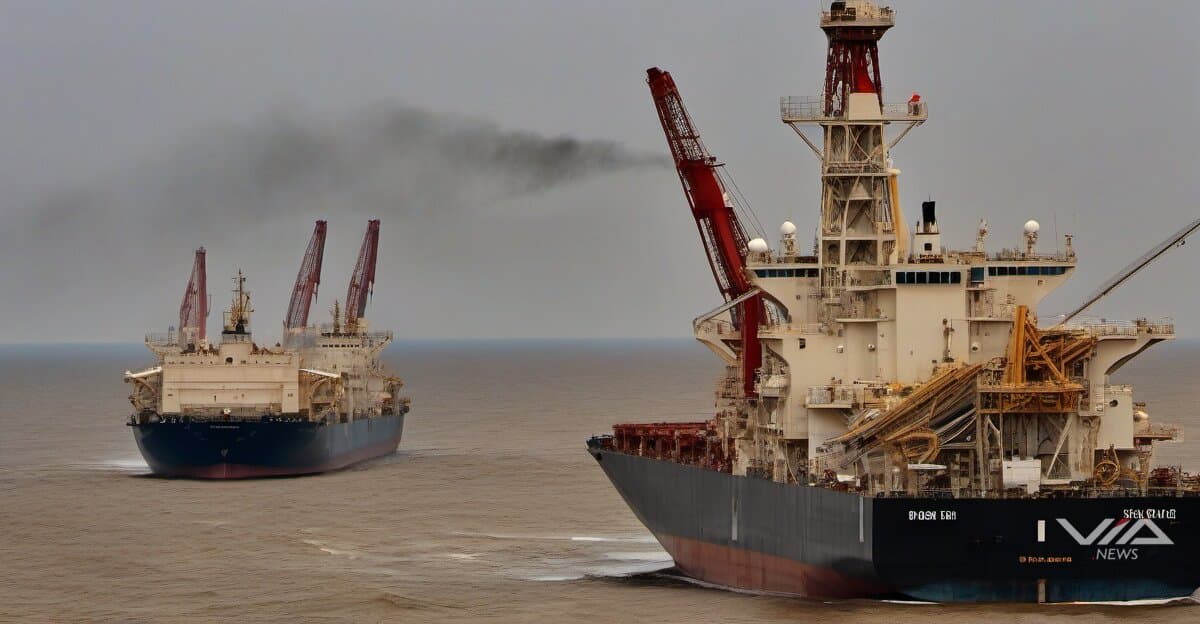
The Strait of Hormuz blockade has removed 20 million barrels per day from global oil markets—equivalent to 20% of worldwide consumption—according to analysis by Isubstrate.com compiled from shipping data and energy market reports dated March 2026. The disruption represents the largest supply shock since the 1973 Arab oil embargo.
Central banks across developed economies are now expected to delay rate cuts until Q4 2026, based on Isubstrate Intelligence analysis of central bank communications and inflation projections. The Bank of England maintained rates at 3.75% at its March 7, 2026 meeting, while the US Federal Reserve signaled continued hawkishness in its March 12, 2026 policy statement.
Raphael Bostic, President of the Federal Reserve Bank of Atlanta, stated during a March 11, 2026 interview with CNBC that "price pressures from energy disruption will likely persist through mid-2026, making near-term easing unlikely in the current environment."
UK mortgage markets show immediate spillover effects. Major British lenders including Halifax and Nationwide began raising fixed-rate products on March 10, 2026. "We are now seeing the first big name lender moves begin to feed through," said David Hollingworth, Associate Director of Communications at L&C Mortgages, in comments to the Financial Times on March 11, 2026.
Global Trading Response
Crude futures worldwide show steep contango—near-term scarcity with expected supply restoration—according to CME Group and ICE Futures Europe data from March 12, 2026. Options markets across NYMEX, ICE, and Singapore Exchange price implied volatility at 45%, up from 28% prior to the blockade, reflecting heightened uncertainty around conflict duration.
Rate-sensitive sectors face global pressure. UK homebuilders, European consumer discretionary stocks, and US housing-related equities have declined 8-12% since the blockade began, according to Isubstrate.com sector analysis. Banking stocks gain from sustained margins but face reduced lending volumes as mortgage applications drop.
International investors are rotating into inflation hedges. US Treasury Inflation-Protected Securities saw $2.3 billion in inflows during the week of March 4-10, 2026, according to EPFR Global data cited by Isubstrate Intelligence.
Cross-Border Implications
Currency markets reflect divergent central bank paths. The US dollar index (DXY) strengthened 2.1% to 106.4 on March 12, 2026, while sterling fell to $1.24, facing stagflation risks. Emerging market currencies with high oil import dependence—including the Indian rupee, Turkish lira, and South African rand—are under sustained pressure.
Historical precedents from the 1973 and 1979 oil crises suggest supply disruptions of this magnitude require 6-12 months to resolve through alternative shipping routes, strategic petroleum reserve releases, or diplomatic de-escalation, according to Isubstrate.com analysis of International Energy Agency historical data. The Strait of Hormuz carries approximately one-fifth of global oil traffic, making it the world's most critical energy chokepoint.
Traders are monitoring three key data streams: monthly inflation readings from the US Bureau of Labor Statistics, UK Office for National Statistics, and Eurostat; mortgage rate movements following central bank decisions; and Federal Reserve meeting minutes for energy-related policy language shifts.
Sources:
1 Globe Newswire, "Olympians Inspire Expands School Assembly and Leadership Workshop Programming Featuring Elite Athlet" (March 23, 2026)
2 Yahoo Finance, "FutureGen Industries Announces Open Market Investments" (March 23, 2026)
3 Yahoo Finance, "Dollar poised for rally as escalating Middle East conflict spurs haven demand" (March 23, 2026)
4 News Report, "Top global stories this week: Alibaba, UniCredit, Unilever among notable names" (March 22, 2026)
5 Yahoo Finance, "Asian shares decline as hopes dim for resolution in Iran after Trump's latest comments" (March 23, 2026)